



Overview
In this article, we’ll dip our toes into the world of being a quant and discuss what it means to learn alpha in the market. Requires some familiarity with linear regression (ie ordinary least squares)
Intuition
Quant trading is about finding significant returns by trading in the market. Assuming that the market has some underlying stochastic process the goal is to maximize

of profit and loss where r_p,t is the return of the portfolio on some timestep. Let’s suppose that you invest $100,000 in some portfolio and in 6 months you’re portfolio is $150,000 dollars, is this a good strategy? That depends on how the market was doing. If you made $50,000 at a time where the S&P500 fell by 5% then this is wonderful. If on the other hand the S&P500 grew by 60% your strategy is actually way worse than the market!
The textbook setup for investment strategy locks the time horizon T and the set of selected positions, P at the initial step. For now, we’ll assume this.
You can follow along with the code at the gist here.
Deriving Alpha
In our toy example we’ll assume we’re investing $100,000 and walk through one strategy of investing our positions. We'll test our model on daily data from May 2026 to June 2026 and train our trading model on data from 1st of September of 2025 to the 1st of July 2026.
-
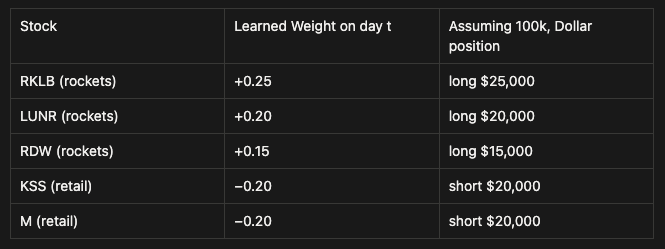
First select your positions. Suppose you’re interested in the rocket industry so you select RKLB, LUNR, RDW and the retail industry so you select KSS, M. This is our set of positions P. We can express each position as a fraction of capital, where each “weight” is how we allocate the position every day.
-
Next, we decide that the S&P500 will be our “market” stock, ie if our trading strategy was to naively dump all our money into the S&P. Call the returns from this r_{market}
-
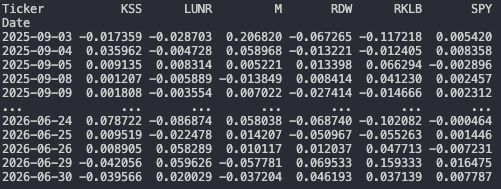
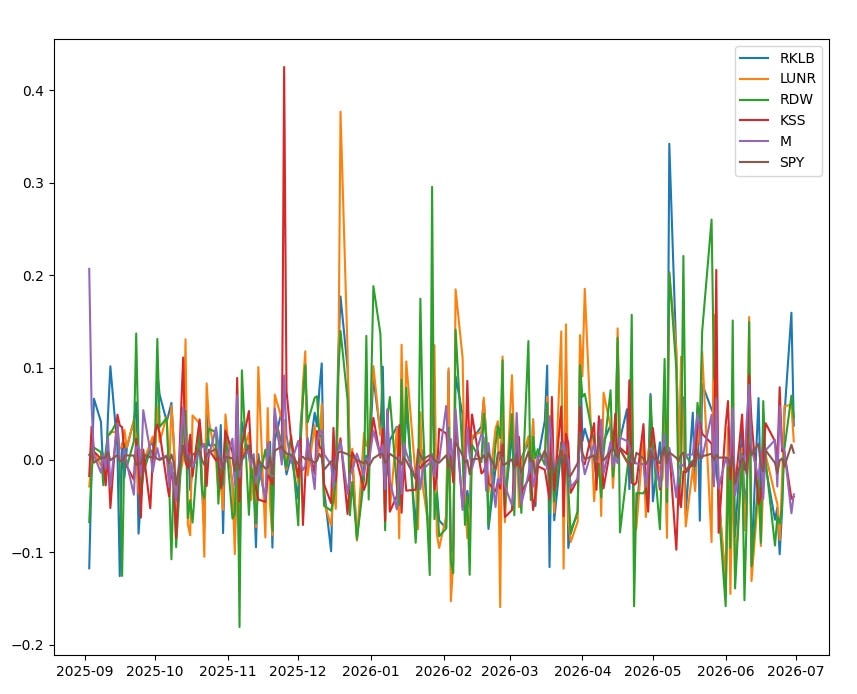
We observe daily the stock return for each stock i and each day. We need to observe the daily stock returns & volume

-
Next we need to select a set of predictive features: variables that we can use to help predict the daily return. Bloomberg’s entire business model is about supplying the data to help with these predictions. Formally we’re constructing x in the following regression

Which is an ordinary least squares setup (we can put x into homogenous coordinates and solve). In our case let’s set x to be.
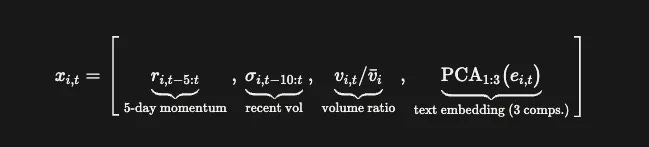
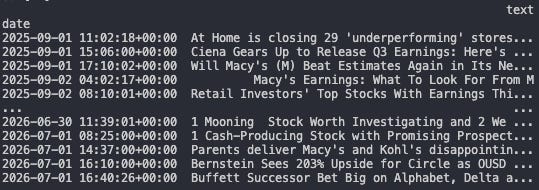
The interesting tidbit here is the optional text embedding from market reports. Here we run a basic model2vec then PCA on news article headlines from Finnhub for each ticker aggregated weekly (ensuring we don’t mix the future).
-
Now that we have this all setup, we can train our model on data from Sep 2025 to May 2026, using May & June 2026 as our holdout test set. Once we learn the following we can predict the returns for May and June.

-
Our predicted returns for the time frame of May & June 2026 becomes

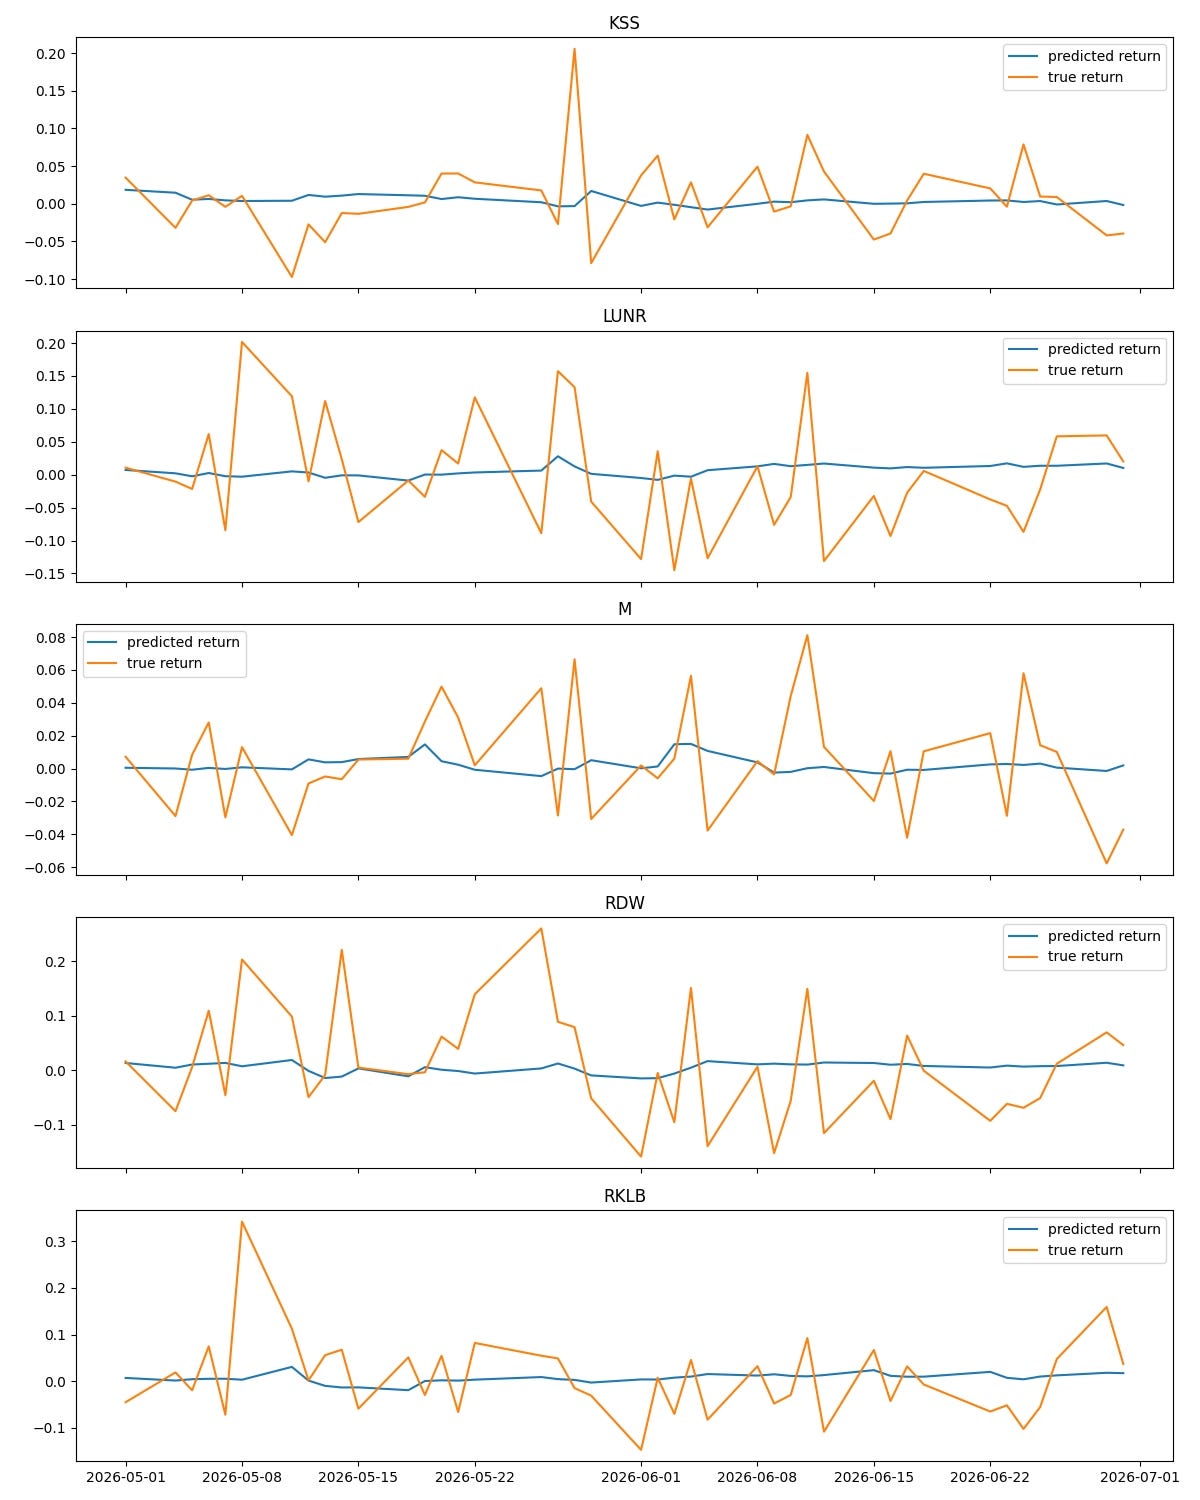
We then convert predictions into weights with a fixed rule to construct exposure which for now allocates the entire portfolio. We subtract the cross sectional mean of the predicted returns which removes the common level of the prediction scores to produce a dollar neutral portfolio.

Put simply our trading strategy is “for a market normalized set of observed returns allocate our $100,000 position everyday based on the features we selected ie momentum, volatility, volume ratio, and news features”. By construction each weight for each day and stock sums to 0 (because normalized to 0) and the absolute sum is 1.
A comment here is this deploys the full portfolio at max exposure. We can improve this strategy if need be but for this overview we’ll leave it like this.
-
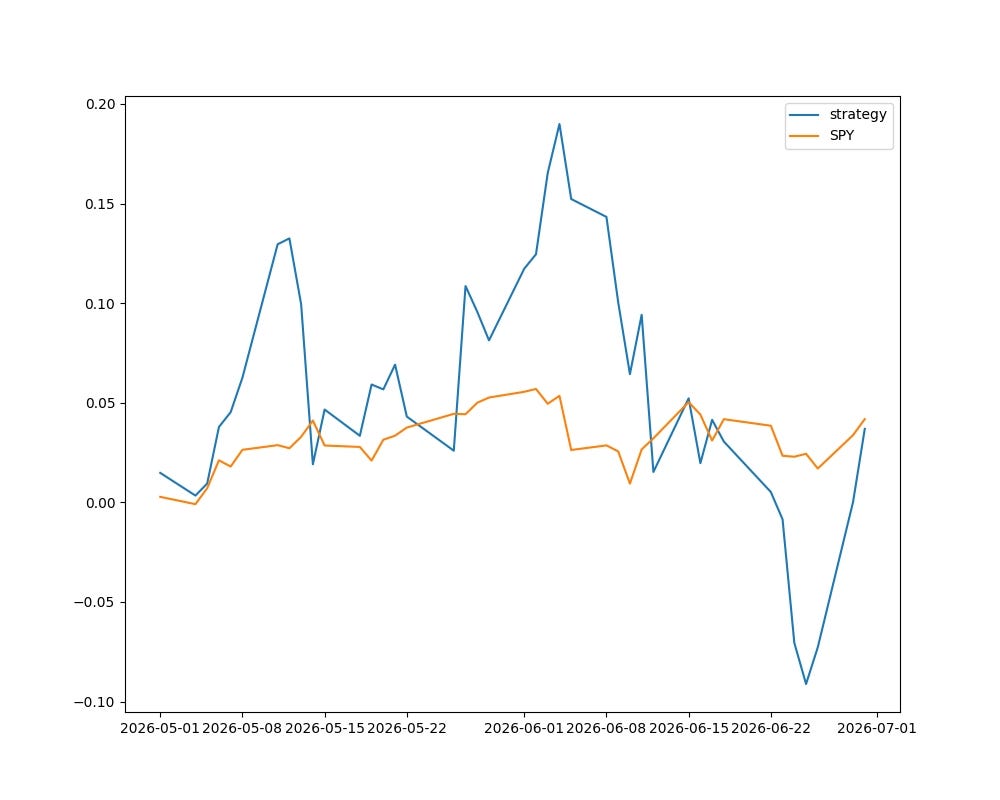
The realized return at some timestep is the weighted sum across each stock yielding

And our diagnostic backtest that measures how similar we are to the market is

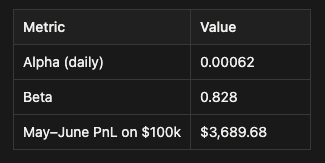
After fitting another linear model to this we get an alpha value. Note that this has not been statistically checked.
Comments
Now before we start clapping and thinking this is a terrific model there are a few caveats that we haven’t tested yet. Firstly, this model is incredibly sensitive. If we change the Finhub API to also include a small summary our strategy suddenly sucks very badly!
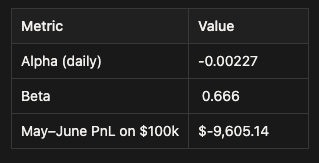
The reason for such a significant change is b/c our model is not very robust in x. Small changes to the features cause significant losses in this case the language that’s used. Ideally, we add so many features such that the total information captured about the environment increases (in the Information Theory sense). Additionally, we have very few samples we’re actually training on and we didn’t see this because we didn’t measure this on a large enough population of points.
Prelude to Agents trading for Sequential Decision Making.
Our portfolio already rebalances each day, ie the weights that we calculate at each timestep, but every allocation is calculated from only the current features. The model doesn’t consider the existing portfolio, the cost of changing it, or how today’s allocation affects future choices. Which is exactly how humans trade, we look at some set of features whatever those may be, then we find weights for each of our positions allocating from our portfolio, and then we wait and observe possibly rearranging as more info comes. An agentic decision making process in our stock environment is something like
-
s_t is the existing state of the world holding information of previous returns of our portfolios. This also includes our current positions, our current portfolio’s value, and the price of reweighing.
-
a_t is the action for how we reweigh each of these. The delta applied to each position.
-
r_t+1 is the return after a single day of trading also considering costs. It’s our weight for all our positions multiplied by the returns for t+1 minus the cost of reweighing.

We’ll make this more formal in a follow up article!
References
[1] Note two definitions gross and net. Gross means total money at risk (as written that’s 1) and net is directional ie we’re net +20% when summing all the weights.